DID Underdiagnosis Series — Article 1 of 5
If you ask most psychiatrists how many of their patients have dissociative identity disorder, the typical answer is: very few, maybe none. That answer is almost certainly wrong, not because clinicians are incompetent, but because DID is systematically invisible to standard assessment protocols. The best way to understand how large the diagnostic gap is, is to do the math.
This article builds that calculation in four steps, using publicly available data from the CDC, WHO, and peer-reviewed prevalence research. Each step is transparent about where the numbers come from and where estimates are being derived rather than directly cited.
Step 1 — How Common Is Childhood Abuse in the United States?
The epidemiological foundation begins with how prevalent childhood trauma actually is. The CDC Adverse Childhood Experiences (ACE) study, conducted across more than 17,000 adults, is the most cited U.S. dataset on this question:
| Category | CDC-Reported Prevalence | Estimated U.S. Adults Affected (base: 260M) |
|---|---|---|
| Childhood sexual abuse, Women | ~25% of adult women (1 in 4) | ~33.3 million |
| Childhood sexual abuse, Men | ~7.7% of adult men (1 in 13) | ~9.8 million |
| Childhood sexual abuse, Combined | ~16.5% of all adults | ~43 million |
| Childhood physical abuse | ~28% of all adults | ~72.8 million |
| Sexual or physical abuse (either/or) | ~35–38% (overlap-adjusted)* | ~91–99 million |
| Any ACE score ≥1 | ~64% of all adults | ~166 million |
The 35–38% “either/or” figure removes individuals counted in both the sexual and physical abuse categories. If 16.5% have CSA and 28% have physical abuse, simple addition would give 44.5%, but because some individuals experienced both, the true “any abuse” rate is lower. The 35–38% estimate applies a standard set-union correction using an estimated co-occurrence rate of ~8–10% drawn from ACE study data showing that multiple ACE categories frequently cluster together.
These figures are self-reported, which systematically understates actual prevalence. Childhood sexual abuse in particular carries social stigma and involves memory disruption, both of which suppress reporting rates. Actual abuse prevalence is likely higher than what the ACE study captures.
Step 2 — What Rate of Abuse Survivors Develops DID?
This is the most methodologically important step, and the one that requires the greatest transparency. There is no single published study that states “X percent of childhood abuse survivors develop DID.” What the literature provides instead are two independent data points that, when combined, allow us to derive a reasonable estimate:
Data Point A — Community Prevalence of DID
Multiple community-based studies using structured dissociation-specific interviews have found DID in 0.4% to 3.1% of the general adult population. The most cited single-study figure comes from Johnson et al. (2006), which found 1.5% past-year DID prevalence in a U.S. community sample. A broader review by Sar (2011) summarizes the range across multiple methodologies.
Data Point B — Childhood Abuse Prevalence
As established in Step 1, approximately 16.5% of U.S. adults report childhood sexual abuse, and approximately 28% report childhood physical abuse.
Derived Rate — What the Math Implies
If we accept a community DID prevalence of 1.5% of all adults, and if we assume that virtually all DID is trauma-related (a position explicitly stated in the ISSTD treatment guidelines and supported by the meta-analytic literature), then the implied rate of DID among childhood sexual abuse survivors can be calculated as follows:
If 16.5% of all adults have CSA histories, and 1.5% of all adults have DID, and if DID arises predominantly from this group, the implied DID rate among CSA survivors is approximately 1.5 ÷ 16.5 = ~9%.
This calculation implies a higher DID rate within the CSA population than the 1–5% working range used in our projections below. We use 1–5% as a deliberately conservative range for several reasons: not all DID is exclusively linked to CSA; protective factors reduce DID development in many survivors; and the 1.5% community prevalence figure may itself be an underestimate given that community surveys likely miss covert DID presentations. Using 1–5% produces projections that are conservative relative to what the math strictly implies.
Step 3 — The Projections
Applying the 1–5% conservative range to the CSA survivor population, and separately using the community prevalence method as an independent check:
| Method | Population Base | Rate Applied | Projected U.S. Cases |
|---|---|---|---|
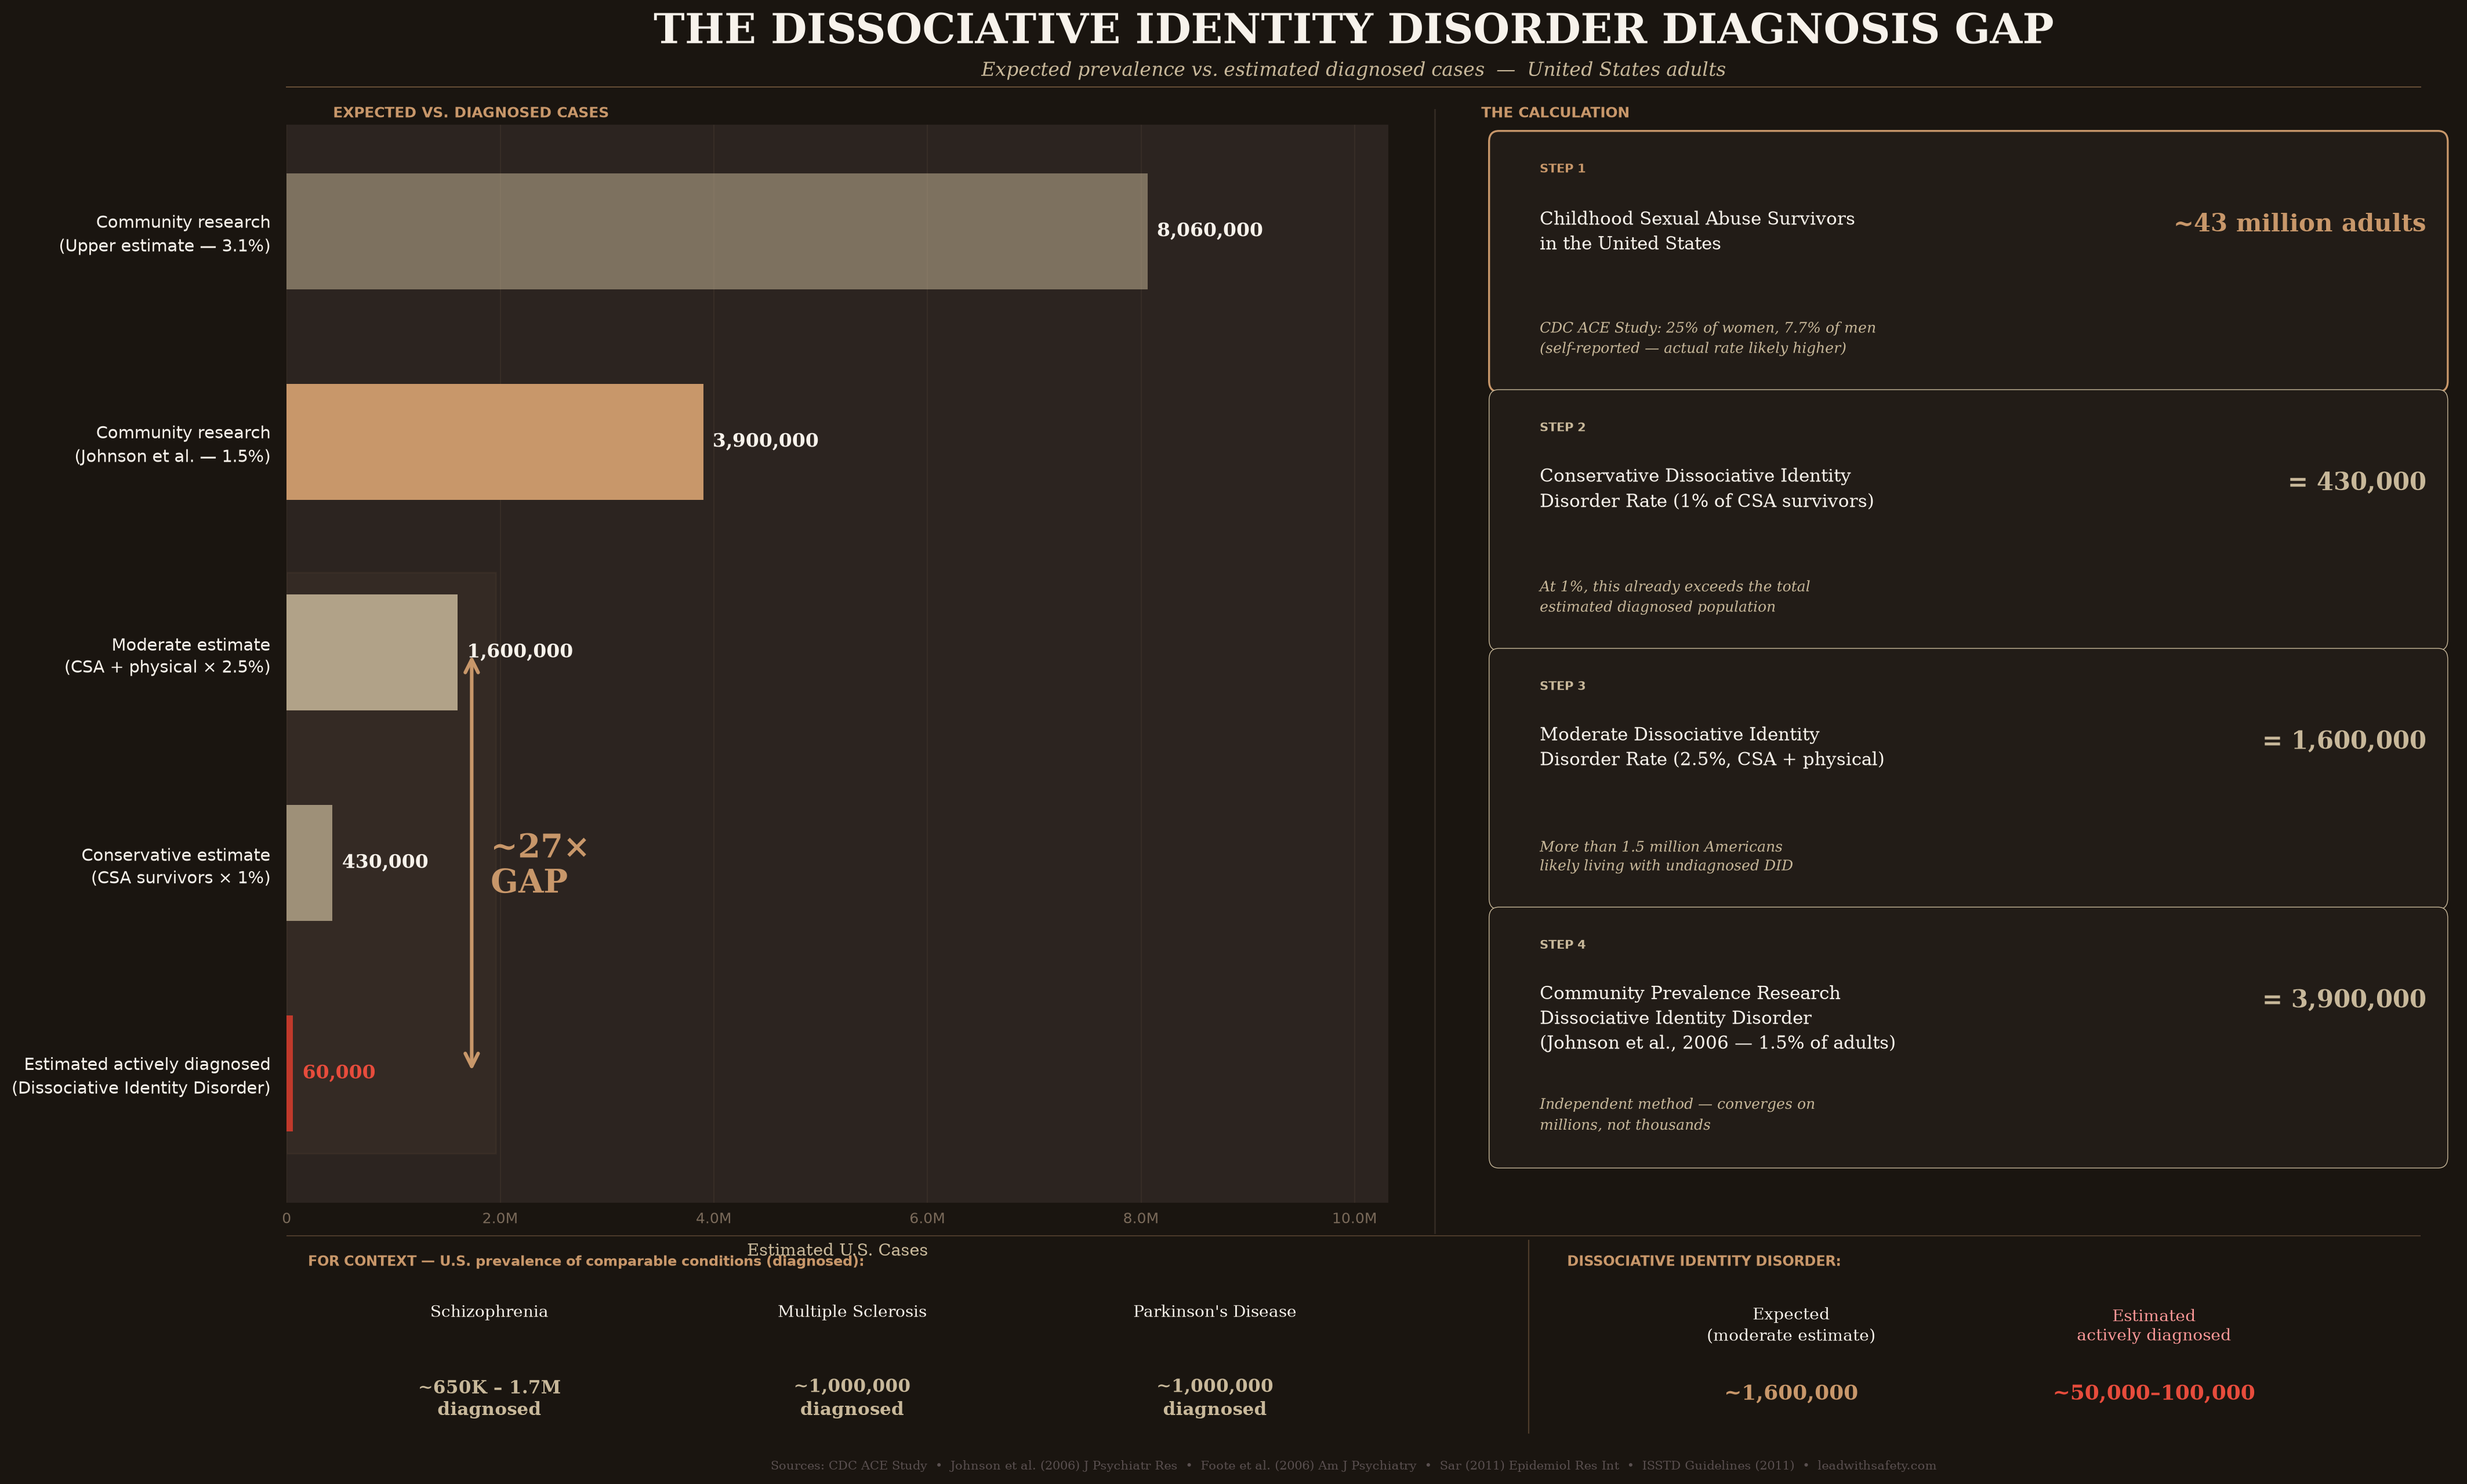
| Trauma-based (conservative) | 43M CSA survivors | 1% | ~430,000 |
| Trauma-based (midpoint) | 43M CSA survivors | 2.5% | ~1,075,000 |
| Trauma-based (upper) | 43M CSA survivors | 5% | ~2,150,000 |
| CSA + physical (conservative) | 91M abuse survivors (overlap-adj.) | 1% | ~910,000 |
| CSA + physical (midpoint) | 91M abuse survivors (overlap-adj.) | 2.5% | ~2,275,000 |
| Community prevalence method | 260M U.S. adults | 1.5% | ~3,900,000 |
| Community prevalence (upper) | 260M U.S. adults | 3.1% | ~8,060,000 |
The trauma-based calculation and the community prevalence research are methodologically independent. One starts from abuse rates, the other from direct population screening. The fact that both approaches converge on hundreds of thousands to several million cases is more meaningful than either figure alone.
Step 4 — How Many Are Actually Diagnosed?
This is the number we most need and the number that is hardest to establish. No national registry tracks active DID diagnoses in the United States. The following evidence allows reasonable inference, though it cannot produce a precise count:
- Foote et al. (2006) found DID in 6% of psychiatric outpatients using structured assessment, but only 5% of those identified patients had ever received a dissociative-disorder diagnosis from their treating clinicians.
- Multiple clinician surveys report that significant proportions of mental health professionals have never seen a confirmed DID case, a finding inconsistent with a disorder truly present in 0.01% of the population, but consistent with one that is present but unrecognized.
- DID is diagnosed in fewer than 1% of psychiatric outpatients in most routine clinical settings, even where structured assessment suggests prevalence several times higher.
- The ISSTD treatment guidelines explicitly state that DID is not rare and that failures in diagnosis stem primarily from education gaps and missed assessment, not from genuine rarity.
The absence of a national DID registry is not a methodological limitation of this analysis alone. It is a structural gap in how the disorder is monitored at the public health level.
Step 5 — The Gap in Context
| Condition | Prevalence Basis | Estimated U.S. Cases | Type of Figure |
|---|---|---|---|
| Schizophrenia | NIMH / WHO diagnosed prevalence | ~650K–1.7M | Diagnosed |
| Multiple Sclerosis | National MS Society | ~1,000,000 | Diagnosed |
| Parkinson’s Disease | Parkinson’s Foundation (adults 45+) | ~1,000,000 | Diagnosed |
| DID, Conservative Estimate | CSA survivors × 1% (trauma method) | ~430,000 | Expected/derived |
| DID, Midpoint Estimate | CSA + physical × 2.5% (trauma method) | ~1,600,000 | Expected/derived |
| DID, Community Prevalence | Johnson et al. 2006, 1.5% of adults | ~3,900,000 | Community survey |
| DID, Estimated Diagnosed | Inferred from chart-review studies | Unknown; likely <100K | Inferred |
The comparison to schizophrenia, MS, and Parkinson’s requires care. Those figures represent diagnosed prevalence, people who have received and retained a formal clinical diagnosis. The DID figures represent expected or community-survey prevalence, not diagnosed prevalence. The appropriate inference is narrower: if even the conservative expected DID estimate (~430,000) is in the same order of magnitude as diagnosed schizophrenia, the characterization of DID as “too rare to matter” does not survive the comparison.
What the Numbers Actually Mean
This analysis does not prove that every complicated, treatment-resistant, trauma-exposed patient has DID. It proves something narrower and more defensible: that DID cannot be rare if the conditions under which it develops are not rare, and that the diagnostic gap between expected and recognized cases is large enough, by any reasonable estimate, to constitute a systemic clinical failure.
The math does not require precision to reach that conclusion. Whether the true expected prevalence is 430,000 or 3.9 million, and whether the truly diagnosed population is 30,000 or 90,000, the ratio is the same order of magnitude: somewhere between 5:1 and 100:1, with current clinical practice identifying a small fraction of people who likely have the disorder.
The argument that DID is too rare to routinely assess for cannot survive contact with basic multiplication. The burden of proof has shifted: it now falls on those who claim DID is rare to reconcile that claim with the scale of childhood trauma and the convergent evidence from community prevalence research.
Those unidentified individuals are receiving diagnoses (depression, BPD, bipolar, ADHD, schizophrenia) and treatments calibrated to those diagnoses. Some improve. Many do not. The dissociative structure underlying their presentation is not being addressed, because it has not been identified.
Better assessment is the immediate clinical need. The tools exist. The questions are not complicated. What is missing is the professional consensus that DID is common enough to look for.
The Infographic
Selected References
- CDC. Adverse Childhood Experiences (ACEs). cdc.gov/violenceprevention/aces. Reviewed 2024.
- Felitti VJ et al. Relationship of Childhood Abuse and Household Dysfunction to Many Leading Causes of Death. Am J Prev Med. 1998;14(4):245–258.
- Johnson JG, Cohen P, Kasen S, Brook JS. Dissociative disorders among adults in the community, impaired functioning, and axis I and II comorbidity. J Psychiatr Res. 2006;40(2):131–140.
- Foote B, Smolin Y, Kaplan M, Legatt ME, Lipschitz D. Prevalence of dissociative disorders in psychiatric outpatients. Am J Psychiatry. 2006;163(4):623–629.
- Sar V. Epidemiology of Dissociative Disorders: An Overview. Epidemiology Research International. 2011;2011:404538.
- Vonderlin R et al. Dissociation in victims of childhood abuse or neglect: a meta-analytic review. Psychol Med. 2018;48(15):2467–2476.
- Brand BL et al. Separating fact from fiction: an empirical examination of six myths about dissociative identity disorder. Harv Rev Psychiatry. 2016;24(4):257–270.
- ISSTD. Guidelines for Treating Dissociative Identity Disorder in Adults, Third Revision. J Trauma Dissociation. 2011;12(2):115–187.
- Boysen GA. Dissociative Identity Disorder: A Review of Research From 2011 to 2021. J Nervous Mental Dis. 2024;212(3):174–186.
- WHO. Child maltreatment. Fact sheet, updated May 2026. who.int.
- NIMH. Schizophrenia Statistics. nimh.nih.gov.
- National Multiple Sclerosis Society. MS Prevalence. nationalmssociety.org.
- Parkinson’s Foundation. Statistics. parkinson.org.
- Beach S. The Beach Safety Hierarchy Assessment Scale (BSHAS): Development and Preliminary Validation of a Five-Level Model of Nervous System Readiness in Trauma-Affected Intimate Relationships. Zenodo. 2026. doi:10.5281/zenodo.19688087